.svg)
Measure and analyze office occupancy
With desk.ly workspace analytics you gain clear insight into how your office is really used. Dashboards, trends and heatmaps show occupancy and the home-office share in real time and over time – so you can spot savings potential and optimise your space based on data instead of gut feeling.
Over 1,000 companies worldwide rely on desk.ly































The most important things in real time
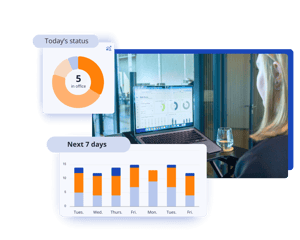
What is the occupancy rate and how high is the home office share? The dashboard gives you a quick overview of the current workload and an outlook for the next seven days.
Analyze utilization and user status in detail
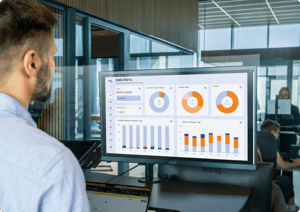
The admin area offers you comprehensive evaluations of your office and heat maps. Both on a daily basis and over time, you can gain insight into
- the use of your workstations and rooms by day of the week and over time
- the utilization of your locations
- the user status - home office compared to the office
.png?width=300&name=Headergrafiken_54%20(37).png)
The most reliable way to measure capacity utilization
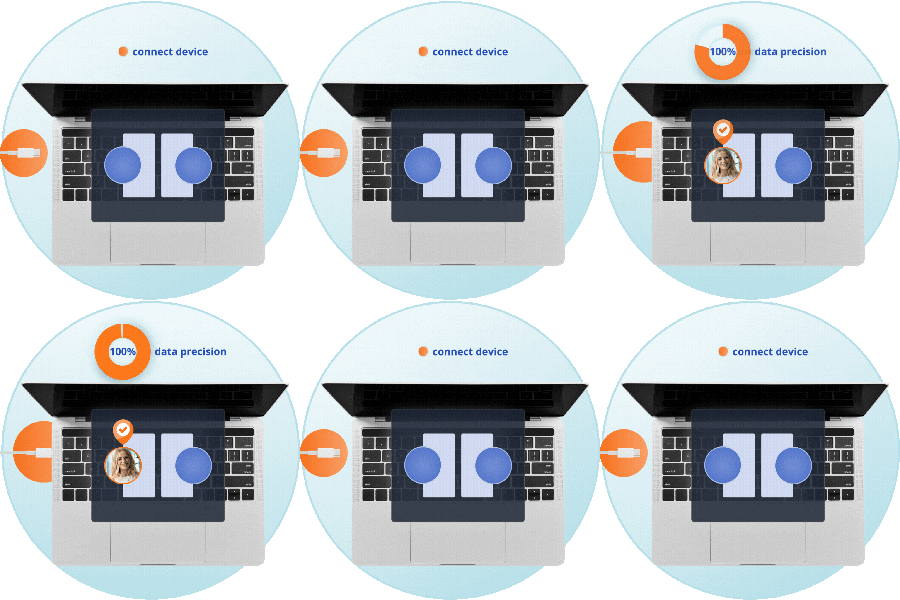
desk.ly Connect automates bookings and check-ins for up to 100% accurate occupancy data. Whether planned or spontaneous booking - everything is recorded and takes your evaluations to a new level.
 Recognize potential
Analyze the usage data and derive optimization potential for your working environment.
 Reduce running costs
Optimizes your regular purchases or cleaning services on the basis of capacity utilization.
 Optimize license usage
In the Admin Dashboard, you can see how many of your licenses you are currently using. This makes it easier for you to manage users and onboard new colleagues.
 Filter resources
Evaluates the use of individual resource types, such as meeting rooms or parking spaces.
 Individual analysis
Transfer your booking data to your systems with the RESTful API and make your very own analyses.
 Analyst as a role
Assigns the analyst role to individuals and gives them access to important booking data.
Make data-based decisions that pay off
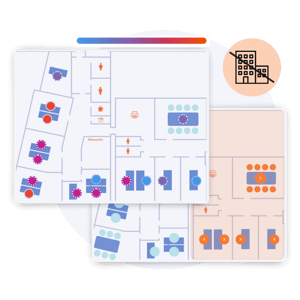
Conversion, new build, renting out? Understand your actual space requirements and make informed decisions.

On which days do few employees come into the office? Occupancy data helps you to plan purchases for the canteen sustainably.
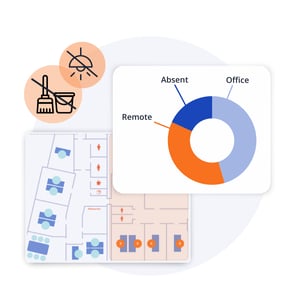
Adapt your resources and cleaning intervals to the office workload to save energy or costs.

For your security desk.ly is GDPR compliant & ISO 27001 certified
Case studies with desk.ly

When Kia Germany moved into its new headquarters, it also switched to a new booking tool for greater functionality.


Reduced from 7,500 to 4,000 square meters: Thanks to the booking data in desk.ly, it was possible to evaluate the actual space requirements.


mobile.de introduced Desk Booking in record time and optimized spaces based on data.


Strong growth and seasonal fluctuations meant that the office was bursting at the seams - until OMR desk.ly came along.

.png?width=300&name=Icon%20Designs%20Relaunch%20(4).png)
When the previous solution reached its limits, the decision was made to use desk.ly. These advantages convinced the municipal utilities.


In this way, PPI maintains the focus on exchange and collaboration for 800 employees despite mobile working.


In this way, the IT system house gives its employees flexibility without losing cohesion.
